Convert Oklahoma PLSS to Lat/Long in Power BI & Excel
Convert Oklahoma Section-Township-Range to lat/long for Power BI, Excel, and Google Sheets: a batch geocoding workflow for O&G well tables, with code.
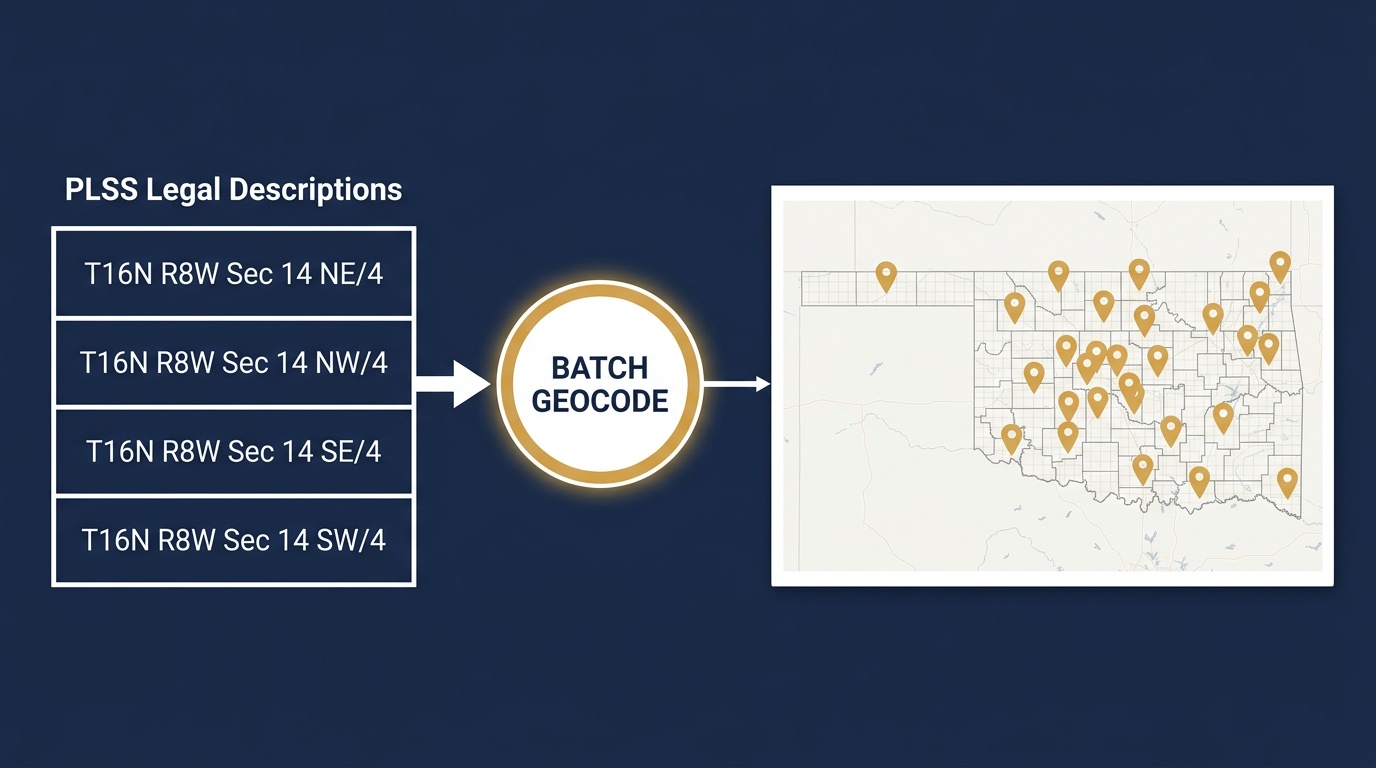
A production team hands you an Oklahoma well table. Every row carries a legal description like T16N R8W Sec 14, Indian Meridian: clean, precise, and completely unreadable to Power BI. Drop that column onto a Map visual and you get nothing, because Power BI geocodes place names and latitude/longitude, not Public Land Survey System grid references.
This is the gap O&G data teams hit when they try to convert Oklahoma Section-Township-Range to lat/long for Power BI. The wells live in PLSS, the dashboard needs coordinates, and there's no built-in step between them. Here is the workflow that closes that gap, covering Power BI, Excel, and Google Sheets, and how to run it across a few thousand rows without converting them by hand.
Why the legal description won't plot
A PLSS description is a position on a survey grid, counted from a principal meridian's initial point. T16N R8W Sec 14 means Township 16 North, Range 8 West, Section 14, but that grid coordinate only resolves to a place once you know the meridian. Read it under the Indian Meridian and you're in Kingfisher County's STACK play; the same Township and Range under a different meridian is somewhere else entirely.
Power BI has no concept of any of this. So the fix is a geocoding step that runs before the visual: legal description in, latitude/longitude out, joined back onto the well table. The Township America API does that conversion against BLM survey data and returns GeoJSON, which every one of these tools can parse.
Power BI: geocode in Power Query
Power BI's data layer is Power Query, and Power Query can call a REST endpoint during refresh. That makes it the natural place to convert the legal-description column. Send the column to the batch endpoint, then expand the returned coordinates into two new columns.
let
    Wells = Source[Data],
    Descriptions = Table.Column(Wells, "LegalDescription"),
    Body = Json.FromValue([descriptions = Descriptions]),
    Response = Web.Contents(
        "https://api.townshipamerica.com/v1/batch/search",
        [
            Headers = [#"Authorization" = "Bearer " & ApiKey,
                       #"Content-Type" = "application/json"],
            Content = Body
        ]
    ),
    Features = Json.Document(Response)[features],
    Coords = Table.FromList(Features, each {
        _[properties][description],
        _[geometry][coordinates]{1},   // latitude
        _[geometry][coordinates]{0}    // longitude
    }, {"LegalDescription", "Latitude", "Longitude"})
in
    Coords
Merge Coords back onto your well table on LegalDescription, and point a Map or Azure Maps visual at the new Latitude and Longitude fields. Because the call lives in the query, a scheduled dataset refresh re-geocodes any new wells automatically, with no manual export or copy-paste. For the single-lookup case while you're building the query, the Oklahoma PLSS converter confirms a coordinate by eye before you wire up the batch call.
Excel: same engine, an Office Script for one-offs
Excel runs the same Power Query engine, so the M query above works unchanged inside Excel's Data → Get Data → Blank Query. For a full well sheet, that's the path to take: it handles thousands of rows and refreshes on demand.
For an ad-hoc single conversion you might reach for a formula, but Excel has no native function that parses a JSON response: WEBSERVICE only pairs with FILTERXML, which expects XML, not the GeoJSON the endpoint returns. The one-cell path that actually works is a short Office Script that calls the search endpoint and writes the coordinate next to the description:
async function main(workbook: ExcelScript.Workbook) {
  const cell = workbook.getActiveCell();
  const desc = cell.getValue() as string;
  const res = await fetch(
    `https://api.townshipamerica.com/v1/search?q=${encodeURIComponent(desc)}`
  );
  const [lng, lat] = (await res.json()).features[0].geometry.coordinates;
  cell.getOffsetRange(0, 1).setValue(`${lat}, ${lng}`);
}
Select the cell holding T16N R8W Sec 14, Indian Meridian, run the script, and the latitude/longitude lands in the next column. Keep the script for spot checks and use Power Query for the table. The same batch conversion workflow backs both.
Google Sheets: a column function
Google Sheets has no Power Query, so the conversion runs through the Township America Google Sheets add-on. Once installed, it registers a custom function you fill down a column:
=TA_TO_LATLONG(A2)
With your legal descriptions in column A, drop that formula in B2, fill it down, and each row resolves to its latitude/longitude. It's the right fit for a smaller lease workbook a land team keeps in Sheets, where standing up a Power BI dataset would be more machinery than the job needs.
Performance: convert the whole table in minutes
The reason this holds up on production data is the batch endpoint. It accepts up to 100 PLSS descriptions per request and returns all 100 coordinates in a single GeoJSON response, typically in under 200 milliseconds. A 5,000-row Oklahoma well table is 50 calls, done in well under a minute, not the afternoon a manual lookup would cost.
That headroom matters when a table spans meridians. An Oklahoma dataset that reaches into the panhandle mixes the Indian Meridian with the Cimarron Meridian, and a multi-state O&G portfolio adds the 6th Principal Meridian and others. The batch endpoint carries each description's meridian through the conversion, so you don't pre-sort the table by survey system. Sub-meter centroid accuracy on every row means the pins land in the right Section, not a grid-formula approximation.
Worked example: a SCOOP/STACK production dashboard
Say you're building a production dashboard for Oklahoma's SCOOP and STACK plays. The well master arrives as PLSS: T16N R8W Sec 14, Indian Meridian in the Kingfisher County STACK, T7N R6W Sec 22, Indian Meridian down in the Grady County SCOOP, joined to monthly volumes from the state corporation commission.
The pipeline is three steps. Power Query pulls the well master and pipes the legal-description column through the batch endpoint, adding Latitude and Longitude. The production table joins on the well's API number. An Azure Maps visual plots each well, sized by cumulative production and colored by operator. Because the geocoding lives in the refresh, next month's new permits flow onto the map the moment volumes land, with no manual re-run needed. To enrich the same sections with permit and operator context, the Oklahoma oil & gas well data pages return wells by legal description for the exact Sections your dashboard maps.
Wire it into your stack
Converting Oklahoma Section-Township-Range to lat/long for Power BI is a data-prep step, not a manual chore: one API call in the query that loads your model, and the map takes care of itself. The same call works in Excel and Google Sheets, so a team can standardize on one conversion source across every tool it already uses.
See the API docs for the single and batch endpoints. Both return GeoJSON you can parse directly in Power Query. If your dashboards need the parcel as a polygon rather than a center point, GIS-ready PLSS exports on Business return full Section and quarter-section boundaries as GeoJSON, Shapefile, or KML.